Mermaid.js renders the diagrams on this blog. The source lives in .mmd files and is compiled to static SVG at build time, so each diagram ships as a plain image with no client-side JavaScript. Below are a few examples of what you can do.

Temperature by Day of Week
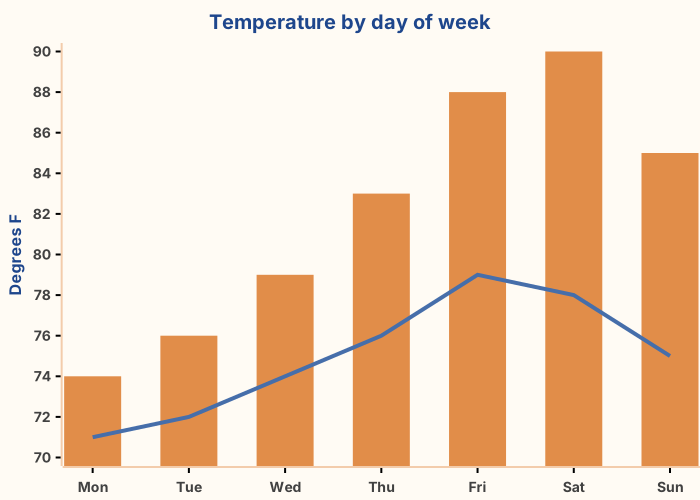
Bar-and-line chart of high and low temperatures across a week, with bars for daily highs and a line for daily lows.
High and low temperatures across a week.

More Examples

Flow Chart

Flowchart of a CI/CD pipeline: a developer push enters the CI pipeline; passing tests build a Docker image, push to a registry, deploy to Kubernetes, and update the service, while failing tests notify the developer.
A simple deployment flow.

Sequence Diagram

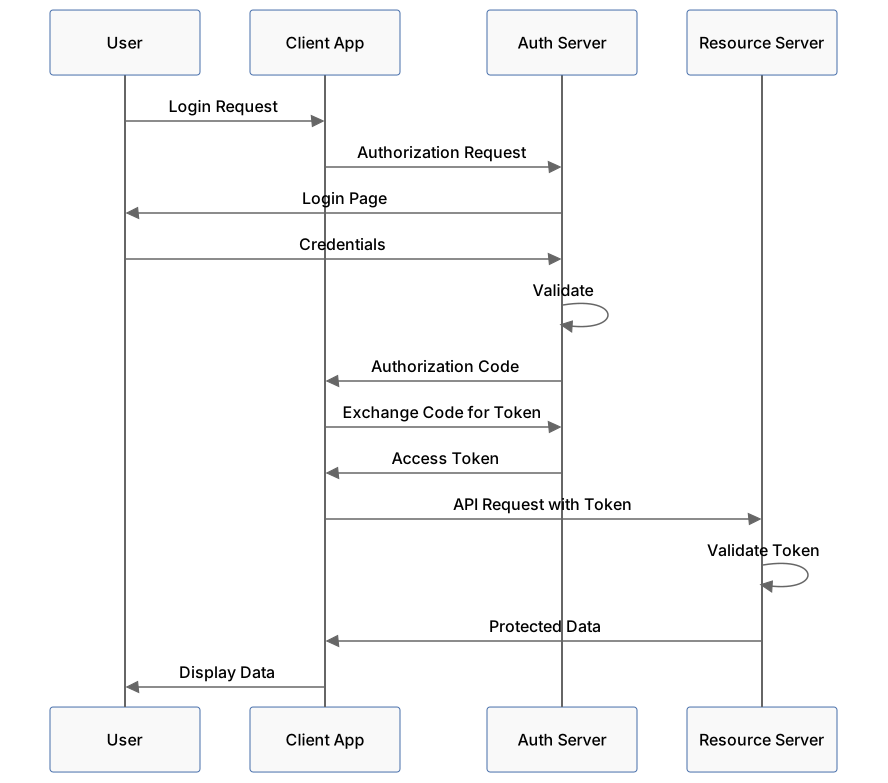
Sequence diagram of an OAuth2 authentication flow between a user, client app, authorization server, and resource server, ending with the client displaying protected data to the user.
An OAuth2 authentication flow.

State Diagram

State diagram for order processing: orders move from Pending to Processing or Cancelled, then to Shipped or Refunded, and Shipped orders become Delivered before the process ends.
Order processing states.

Task Priority Matrix

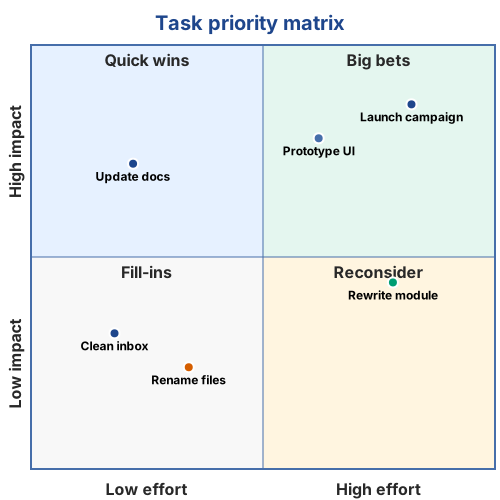
Quadrant chart organizing tasks by effort and impact into quick wins, big bets, fill-ins, and work to reconsider.
Generic tasks sorted by impact and effort.

Git Flow

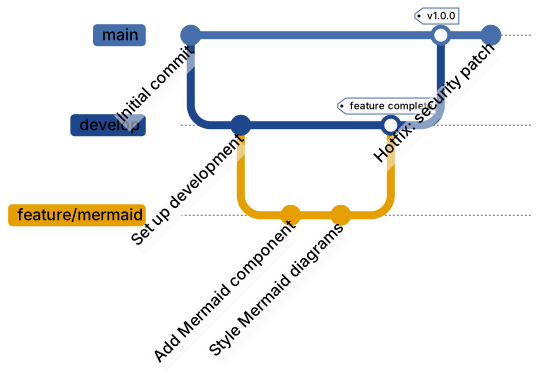
Git Flow branching diagram: a feature branch off develop merges back into develop, develop merges into main for a v1.0.0 release, followed by a hotfix commit on main.
A Git Flow branching model.

Entity Relationship

Entity relationship diagram of a blog schema: users write many posts, posts have many comments, and posts belong to one category, with fields shown for each entity.
Database schema for a blog.

Pie Chart

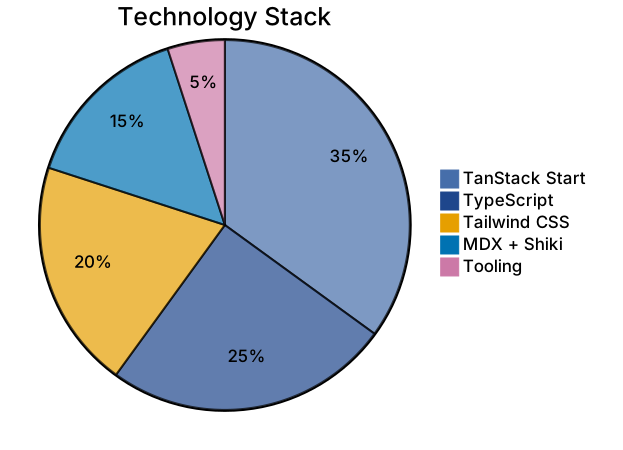
Pie chart of the technology stack: TanStack Start 35 percent, TypeScript 25 percent, Tailwind CSS 20 percent, MDX with Shiki 15 percent, and tooling 5 percent.
Technology stack distribution.

Usage in Markdown

Each diagram is a .mmd file under src/diagrams/<post>/. For example, src/diagrams/mermaid-diagrams/flow-chart.mmd:

flowchart LR
  Start --> Process --> End

bun run render:diagrams compiles every .mmd to a matching SVG under public/ using a shared theme, then the post embeds the result as a static image:

<figure className="static-mermaid-figure">
  <div className="static-mermaid-frame">
    <img
      className="static-mermaid-diagram"
      src="/mermaid-diagrams/flow-chart.svg"
      alt="A short description of the diagram"
      width="{496}"
      height="{712}"
    />
  </div>
</figure>

A diagram that needs custom colors can ship a sibling .mmd-named .css file, which the renderer inlines into the SVG so the image stays self-contained.

Bonus: Code Blocks with Shiki

Code blocks get syntax highlighting at build time via Shiki.

Bash:

k get nodes
NAME    STATUS   ROLES           AGE   VERSION
k8s-1   Ready    control-plane   51d   v1.33.1
k8s-2   Ready    control-plane   51d   v1.33.1
k8s-3   Ready    control-plane   51d   v1.33.1

Rust:

fn main() {
    println!("Hello, world!");
}